Thursday, September 27, 2007

Evaluation: Wind Instrument Design


Wind Instrument Design


My anemometer measuring the outrushing wind of a collapsing thunderstorm. Though my instrument is fairly accurate, it still has many design flaws.

Image by: Justin Reid 9/27/2007


The advent of the wind measuring anemometer made specific wind measurements possible. The anemometer is a 3 or 4 cup rotating device on a short rotating shaft, that measures the wind. Since then, many manufacturures, agencies, and government sources have made anemometers or deviations from the anemometer. Though not all of these devices are made alike


The first type of wind device I will evaluate is the anemometer itself. The classic form of an anemometer is quite simply the standard. But the accuracy of certain anemometers can be far off.


The National Weather Service, ASOS or Automated Surface Observation System. A single station shown above, it uses a classic 3 cup anemometer that is the standard. A wind vane is also present on the t-shaped split column.

Image courtesy: www.weather.gov


The ASOS implies a 3 cup anemometer with a vertical shaft. The shaft design is what makes the anemometer accurate and the ASOS measuraments reliable. Other devices, even my own anemometer, are flawed because of their upside-down design; facing downward


My anemometer in another collapsing thunderstorm a year ago. As seen before, the upside-down facing design makes the anemometer flawed in one direction.

Image by: Justin Reid 6/4/2007


Other wind instruments have been formulated, some are deviations of the anemometer and others are even sonic in nature, but the best out of all the deviations, in my opinion, is a device called the aerovane.


A Rainwise weather station. One of the most expensive and accurate weather stations in the private market, it utilises an aerovane as it's wind speed and direction indicator.

Image Courtesy: www.rainwise.com


An aerovane was originally made by a branch of the armed forces, but it is now made by several private companies (such as Rainwise). The aerovane system is basically the final advancement of direct wind measurement. It combines both the wind-vane and the anemometer together in one unit. This makes the most dominant wind in the area measured, because the aerovane's body (like a wingless airplane) points to the direction of the greatest wind. The impeller (propeller in reverse) measures the wind that the aerovane is pointing to. The National Weather Service still relies on the 3 to 4 cup anemometer for their measurements, but I am a fan of the aerovane, since it greatly reduces crosswind measurement errors in the output of the device. Though the device isn't as sensitive to wind as an anemometer.


Each wind device has been made through many years of scientific reasearch, maybe someday all wind measurements will be made through indirect observations. In the meantime however, there are several options of direct wind measurement. All have their advantages and disadvantages. The right wind instrument is the one that you feel is best. That is very subjective.


A fiery sunset after a frontal passage. Note the slight waving motion of the cirrus cloud near the horizon called Kevin-Hemholtz Waves.

Image by: Justin Reid 7/13/2007

Explanation: Orographic Cloud Formations


Orographic Cloud Formations


This is a mountain-wave cloud formation after a frontal passage. A great example of an orograhic cloud formation, it formed from a standing air wave off of the Appalachian Mountains.

Image By: Justin Reid 7/14/2007


An explanatory process does provide a keener insight on newer things to other people. In atmospherics, there are many such strange phenomenon that can create a dizzying array of wonderful and dreadful effects.


One of these effects is a simple cloud formation. Though this class of cloud doesn't appear normal such as a run-of-the-mill cumulus formation. These clouds are the orographic clouds or clouds that are formed from wind blowing over landforms. The landforms create a flow pattern in the air that creates stationary waves in the local atmosphere. High winds must be prevalent in order to see such clouds in their true variety and size.


Here are some examples of orographic cloud formations, which mostly form at the mid-levels of the atmosphere.


Altocumulus Lenticularis, Photo by: Justin Reid 7/10/2007


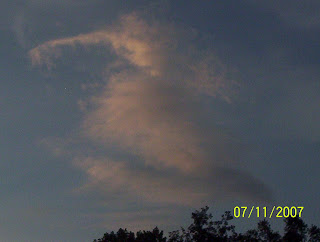
Unique orographic formation, Image by Justin Reid 7/11/2007


All of the images above are orographic in nature. Each are smooth and sloping; not ragged and lumpy. The lens-shaped "UFO cloud" is called Altocumulus Lenticularis another type of orographic cloud is the mountain or Sierra wave. Some orographic cloud formations are as unique as snowflakes and have no distiction. All of these formations however, form from standing air waves from land formations.


A mountain wave after sunset that fomed after a frontal passage.

Image by: Justin Reid 7/11/2007


I hope that this explanation of orographic cloud formations is informative. I hope that on a winter or windy day when you see smooth and unusually-shaped clouds, I hope you can recognize how they form, and what they truly are. Orographic clouds are one of the atmosphere's more interesting formations in my opinion


An unusual orographic formation that formed in the late evening after a frontal passage. A mountain wave sculpted this cloud from leftover moisture and materialized from the lower pressure of the wave.

Image by: Justin Reid 7/11/2007

Wednesday, September 26, 2007

Reflection: Surface Observation Methodology


Surface Observation Methodology


One of my electronic thermometer/hydrometers. Used as a relay point for my anemometer as well, this oddly-shaped unit measures dew point.

Image by: Justin Reid (date not available, incorrect date print on image)


On a recount of methodology, I will now relive a certain methodolgy in atmospheric science called the "surface observation". Unlike the "thermodynamic profile" in my last blog, the surface observation only measures the conditions(such as temperature, wind speed and direction, etc.) at the surface alone. These observations are what weather maps are drawn from like you see on the news reports. Fronts, highs and lows, and other atmospheric aberrations are found at the surface level. There are now mostly automated weather stations called ASOS (Automated Surface Observation System) and others that measure surface conditions automatically; even if it is raining and cloud cover! Though many private observations are still taken the old-fashioned way, the human weather watcher.


I have taken some surface observations. Usually at 4:00 PM when the National Weather Service does their daily climate sum-up. But unlike the ASOS and those who can afford a Rainwise MK model (a very fancy and expensive automatic weather station), all observations must be made with the human observer manning the station. This has lead me to review my observation techniques. Which, the system could be improved by leaps and bounds.


My biggest problem is time continuity. Taking a constant surface observation at a certain time is difficult. Especially with constant appointments or homework interference. There is also sky percentage, which without a celiomenter (a device that measures cloud pecentage and height) cannot be 100% percent accurate. A constant ledger and summary docuement system for each day have been hard to come by. The high and low temperature for each day is also a challenge, because without pressing a reset button at the correct time of day, or forgetting to do so; could interfere with that day's measurement. I have concluded that through this system, a full time observer must be in place for the observing schedule. Automated systems such a Rainwise are beneficial, since the obesever is freed up and has more leeway.


Though some newer systems are actually reverting to the old ways of surface observing. Though some of the techinques I have used in surface observing are extremely tedious. The CoCoRaHS rain gauge network uses a standard National Weather Service rain guage. That guage isn't an automatic electronic one that I have at my home weather station, but a classic acrylic long-term rain gauge that is clear and has to be emptied. The way the CoCoRaHS rain gauge system wants this gauge mounted and used is to reduce inaccuracies. They are even against the automatic rain guage; even on the National Weather Service's own ASOS. This is a special case where good surface observing techniques are used and must be crtiqued. If you still want more info on CoCoRaHS and how to join, I still have a link to their website. It is on my blog "CoCoRaHS is Finally Here!".


One of the rarest images I have ever taken. This is the image of the underside of a tornadic or supercell thunderstorm. This rare system did drop a weak tornado in Cabarrus County. This formation of the supercell called a mesocyclone is the rotating updraft of the supercell that makes it so powerful and the tornado possible. If a tornado formed at my house during this storm, it would have been in this image with the mesocyclone. One of my hail images from this storm made it to a National Weather Service Storm report, click Here to see the report on this system by the National Weather Service and my image published at the bottom of the page.

Tuesday, September 25, 2007

How Pressure-Gradient Windstorms Work: Discovery


How Pressure Gradient Windstorms Work


A pressure-gradient windstorm makes distinct markings in autumn leaves, demonstrating
eddy currents of air in two distinct positions near cylindrical obstacles. Winds were near 40 MPH.
Image By: Justin Reid 11/13/2006


Pressure-Gradient windstorms are one of the most common Autumn/Winter weather effects of our region. Formed from when a Nor'Easter and a strong high pressure or a strong Nor'Easter and weak high pressure, form a giant pressure difference between the two systems. This can create what I call "The Tropical Storms of the Mainland". These windstorms that form from this event can be well over 40 MPH in wind speed, which is tropical storm strength wind on the Saffir-Simpson Hurricane Scale. I have remembered these windstorms for a long time, but how did they necessarily work. I went on a journey of discovery about these windstorms and how they functioned.


My anemometer measuring an outflow boundary during a spring thunderstorm

on 6/04/2006. Image By: Justin Reid


I knew the main mechanics of this strong windstorm. A strong high or low pressure had to be paired with its inverse. I knew that the difference between the atmospheric density of the systems involved was the key to the windstorm's strength. But what governed stronger windspeeds at different times? How did these pressure-gradient windstorms ebb and flow? The answer would not come until later after a few trips to the National Weather Service.


A cold front creates an amazing cirrus and stratocumulus display in the middle of July. Rare for that time of year,

this formation reminds me of several images taken in the weather guide Wind and Weather.

Image by: Justin Reid 7/11/2007.


At the National Weather Service, I learned how meteorologists decipher local upper-level atmosphere conditions. From weather balloons, they make observations called "soundings" also called "thermodynamic profiles". Plotted with dew point, temperature, and wind at different levels of the atmosphere in a certain manner, it can be read to show many different conditions at the lower levels.


An example of an observed sounding from Greensboro, North Carolina. Note the green line denoting dew point and the red line denoting temperature. Each level in the atmosphere is denoted by pressure in millibars like in hurricanes; instead of feet or kilometers. The flags and barbs at the right denote windspeed at a certain level. Image courtesy: The Storm Prediction Center.


How do these soundings and windstorms even relate to one another? I discovered the answer with something called "the mixing level". The mixing level is a point where dew point and temperature stop following a certain rate and begin to radiate into different pathways. At this point, the moisture content (dew point) and wind speed tendencies are brought down to the surface. In pressure gradient windstorms, the wind is strong at the mixing level, around 40 MPH. There that strong wind is brought down to the surface in the event. But how does that explain why wind is stronger at different times? The answer lies in the height of the mixing level. Wind speed generally increases with height, and the mixing-level rises throughout the day. As this level rises the wind increases and the humidity drops. The mixing-level then falls again at night and decreases the wind-speed. This happens every day! In pressure-gradient windstorms however, this effect is exaggerated because of the high winds at the upper-levels of the atmosphere(humidity changes are usually the same). This explains how windstorms are stronger at certain times of the day. Sometimes, there are deviations to this pattern, but even then, it all has to do with the mixing level and the strength of the wind there that makes the windstorm stronger.


This is an image of a "forecast sounding" computer program called Bufkit. Made by the National Weather Service, this program forecasts the thermodynamic profiles used to determine the details of a pressure-gradient windstorm. The program uses several different weather models for the "forecast soundings". Some forecast soundings have a longer range, while some may be more precise.

Bufkit: by the Warning and Decision Training Branch of the National Weather Service and the National Weather Service Forecast Office In Buffalo, N.Y.


This was a discovery situation for me. Learning the mechanics of a powerful windstorm is intruiging This learning process demonstrates the discovery process well and how it can be applied to scientific inquiry.


This is a satellite image of a pressure-gradient windstorm. These systems, also called
Northwest Flow Snow events, are one of the major sources of snowfall in the Smoky Mountains and aid in the skiing tourist industry there
.

Saturday, September 22, 2007

CoCoRAHS Has Finally Arrived!


CoCoRAHS Has Finally Arrived!


I have finally subscribed to CoCoRAHS. I will now provide even more rain, snow, and hail reports to the National Weather Service. My station ID is NC-LN-2 and I hope to be reporting rainfall and other precipitation data in the next week or so. Look on my other blogs to see the links to the CoCoRAHS homepage for more information if you want to be a CoCoRAHS observer.


My station location is in northeast Lincoln County. The ID NC-LN-2. Courtesy: www.cocorahs.org.

Thursday, September 20, 2007

The CoCoRAHS Era and an Upper-Level Low


The CoCoRAHS Era and an Upper Level Low


My anemometer measuring out-rushing wind ahead of a severe thunderstorm complex


on 7/10/2007. The high dew points of the day lead to a strong severe weather complex to my north, creating many problems. Image by Justin Reid


9/20/2007


The upper low pattern now deepens from the Gulf of Mexico and the Atlantic Ocean. Now little light showers continue to dot the region with only a few areas receiving only an inch of rain. It is these patterns that are the Murphy's Law of the atmosphere. The general area has much rain, while a local area or locale may not receive any beneficial moisture at all. This clause is one of the main reasons why we are in an extreme drought. This is also another bad test of CoCoRAHS of which I spoke of in my last blog. I've finally worked out the specs for CoCoRAHS and I am about ready to add my locale to its increasingly large network. Anyone can join this network that is interested. I have made a link here so that anyone who wants to join this rain gauge network. CoCoRAHS has its own blog and a cool store with witty T-Shirts sometimes at hand. Also, you can sign up for their e-mail newsletter The Catch. I think that this is a great voluteer program for the public


A band of stratocumulus associated with a cold fron extends outward forlornly in the late evening sky on 3/16/2007.
Image by Justin Reid

Wednesday, September 19, 2007

9/19/2007 Between Weather Systems


9/19/2007 Between Weather Systems


An outward rushing of cold air from a thunderstorm creates a mini cold front.

on July 9, 2007. Image taken by Justin Reid


After the major frontal storm last Friday we, again, enter a stretch of drought. Though the Friday Humberto-Front event has put a major dent in the drought situation. Other than that and a ragged low in Florida that might come into fruition later this week, the area is dominated by another incessant dome of high pressure. On the hydrology terms I am about to join a network of that nature by the 50-cent name of CoCoRAHS (Community Collaborative Rain Hail and Snow). This is a precipitation reporting network for the National Weather Service and aids in hydrology, climatology, and severe weather warnings. Anyone can join so I will provide a link Here to the CoCoRAHS homepage so that anyone can join the CoCoRAHS rain guage network. There is also a slideshow there portraying how to collect the right data from all precipitation types.


A unique view of my tipping-bucket rain-gauge.

Image taken: 7/13/2007 Justin Reid


Monday, September 17, 2007

The Weather Burreau


The Weather Burreau


A blog by Justin Reid


Welcome to The Weather Burreau, a blog of nothing but atomspheric science and weather culture.


Recent Signinficant Weather Events:


Tropical Storm and Front Fusion Rain Event


With a major drought occuring and not much rain abound, where is the source of rain to finally drench our area with much-needed rainfall? The answer lies in a rare type of gullywasher, in which a tropical system fuses with a cold front or a stationary front (front that doesn't move very fast). These two systems combined, can create enough rain to at least cut the drought deficit in half.


This is the image of Hurricane Humberto's landfall in Southeastern Texas. The fastest-devolped hurricane in recorded history, this storm combined with a cold front to form a tropical system-front gullywasher. The setup is rare and it finally began to chip away the recent drought.


This is an image of a computer model called the North American Model (NAM). This portion of the NAM model measures the amount of twist in at the mid-levels of the atmosphere. The amount of twist is called vorticity and the red areas of increased voriticy is where the rain or thunderstorm activity will form (except in low moisture situations). The model discribes Humberto (red area near west Mississippi) fusing with a cold front and extending to the northeast into our area as a line of amorphous orange and yellow vorticity blobs. This is the type of situation, in which heavy amounts of rainfall could result; a tropical-storm and front fusion gullywasher.


This is precipation forecast for the event from 8:00 AM EDT Friday to 8:00 PM EDT Saturday. Though the preciptation dropped slightly since this forecast analysis, heavy rain was almost a definite possibility.


As the storm formed, it was as intense as predicted. Some areas recieved close to 4 inches of rainfall in the northern part of the state. Some sunlight poked out of the storm's major cloud deck, and the resulting heating spawned many tornadoes in northeastern North carolina and northwestern South Carolina. At my home, my electronic rain guage measured 1.10 inches of rainfall. The image above is one of the few images depicting a frontal-tropical storm fusion event and such valuable storms can give beneficial rainfall to an area suffering from a major drought situation.


My Electronic Rain Guage (Also Known as A Tipping Bucket Rain Guage)


About the Author


My name is Justin Reid and I have been interested in the Atmospheric Sciences since I was 5 years old. I have photographed more than 500 images of atmospheric phenomena. I am also Skywarn Storm Spotter for the National Weather Service and I have interned at our local National Weather Service Forecast Office. I also have a home weather station, from which I have taken records since 2006. I am also planning to join a hydrology network by the end of this year.


Image Taken By Justin Reid


Blog Created 9/16/2007, NAM image courtesy of WeatherUnderground, other sattelite images and precip estimates courtesy of HPC, NOAA and The National Weather Service. All other images and web design by Justin Reid. Rainfall measurement made at 35.5 N Lat. and 81.14 W Lon. at Justin Reid's weather station.